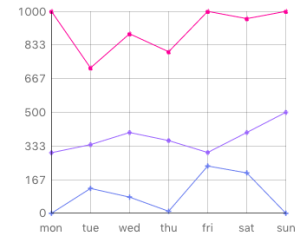
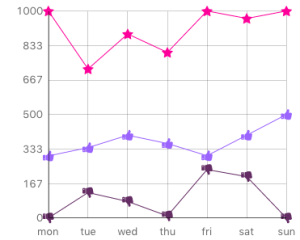
Continuing on from my last blog post where I added the showLines and markerStyles property to the line chart and not being one to know when to stop I realised that what the line chart really needs now is more marker styles. I could come up with some more styles and draw them but that’s not as much fun as what I’m going to do. What I’m going to do is allow you to specify one of the 6 marker styles already implemented and also any icon name from the svg library. We can have beautiful charts with little smiley faces as markers!
SVG Icon Line Markers
So first thing we need to do is add the SVG library as a dependency:
use com.livecode.library.iconSVG
Next for efficiency sake we are going to move as much of the path code out of the loop drawing the vertices as possible. So in the graph line loop we add the following code. The constrainPathToRect handler is from the widget utils module:
variable tFilledMarkers as Boolean
variable tMarkerPath as Path

if mVerticesShow is true then
   if mMarkerStyles[tGraphLine - 1] contains "circle" then
      put circle path centered at point [0,0] with radius 3 into tMarkerPath

      put mMarkerStyles[tGraphLine - 1] contains "filled" into tFilledMarkers
   else if mMarkerStyles[tGraphLine - 1] contains "square" or mMarkerStyles[tGraphLine - 1] contains "diamond" then
      put rectangle path of rectangle [-3,-3,3,3] into tMarkerPath

      if mMarkerStyles[tGraphLine - 1] contains "diamond" then
         rotate tMarkerPath by 45
      end if

      put mMarkerStyles[tGraphLine - 1] contains "filled" into tFilledMarkers
   else
      put path iconSVGPathFromName(mMarkerStyles[tGraphLine - 1]) into tMarkerPath
      constrainPathToRect(rectangle [-3,-3,3,3],tMarkerPath)
      put true into tFilledMarkers
   end if
end if
Then in the vertices drawing loop we just need to add our marker at the correct location to the vertices. Here we are translating the path from the 0,0 origin to the graph point then translating it back so it is ready for the next vertices. It would be feasible to translate it relative to its previous translation but this code is much simpler.
// Draw vertices
if mVerticesShow is true then
   translate tMarkerPath by [tPointX, tPointY]
   add tMarkerPath to tPathVertices
   translate tMarkerPath by [-tPointX, -tPointY]
end if
That is almost it. We just need a slight change to the drawing command to use the tFilledMarkers variable:
if mVerticesShow is true and mMarkerStyles[tGraphLine - 1] is not "" then
   if tFilledMarkers then
      fill tPathVertices on this canvas
   else
      stroke tPathVertices on this canvas
   end if
end if
And now we test…
Well.. your eyesight is probably better than mine but I’m thinking we need a way to scale the markers so they can be a more reasonable size!
The markerScale
We need to implement a new property markerScale which is a scale factor to apply to markers scaling from the default 8×8 point marker. First we write a property definition and documentation:
/**
Summary: A scale factor to apply to markers

Syntax:
set the markerScale of  to
get the markerScale of

Value (real): A scale factor to apply to markers

Description:
The default scale factor is 1 which corresponds to an 8x8 point marker.

Related: markerStyles (property), showLines (property)

*/
property markerScale get mMarkerScale set SetMarkerScale
metadata markerScale.default is "1"
metadata markerScale.editor is "com.livecode.pi.number"
metadata markerScale.step is "0.05"
metadata markerScale.min is "0"
metadata markerScale.max is "5"
metadata markerScale.label is "Marker scale"
We need to add the mMarkerScale instance variable
private variable mMarkerScale as Real
In the OnCreate handler we need to set the default value:
put 1 into mMarkerScale
In the OnSave handler we need to store the value:
put mMarkerScale into rProperties["markerScale"]
In the OnLoad handler we need to read the value:
if "markerScale" is among the keys of pProperties then
   put pProperties["markerScale"] into mMarkerScale
end if
We need a setter so that we can redraw the chart when the value changes:
public handler SetMarkerScale(in pMarkerScale as Real) returns nothing
   put pMarkerScale into mMarkerScale
   redraw all
end handler
Now all we need to do is scale our markers when painting. First we set the value of a size variable to use in sizing the markers:
variable tMarkerSize as Real
put mMarkerScale * 4 into tMarkerSize
Then we update our marker path creation code to scale the markers:
if mMarkerStyles[tGraphLine - 1] contains "circle" then
   put circle path centered at point [0,0] with radius tMarkerSize into tMarkerPath

   put mMarkerStyles[tGraphLine - 1] contains "filled" into tFilledMarkers
else if mMarkerStyles[tGraphLine - 1] contains "square" or mMarkerStyles[tGraphLine - 1] contains "diamond" then
   put rectangle path of rectangle [-tMarkerSize,-tMarkerSize,tMarkerSize,tMarkerSize] into tMarkerPath

   if mMarkerStyles[tGraphLine - 1] contains "diamond" then
      rotate tMarkerPath by 45
   end if

   put mMarkerStyles[tGraphLine - 1] contains "filled" into tFilledMarkers
else
   put path iconSVGPathFromName(mMarkerStyles[tGraphLine - 1]) into tMarkerPath
   put true into tFilledMarkers
   constrainPathToRect(rectangle [-tMarkerSize,-tMarkerSize,tMarkerSize,tMarkerSize],tMarkerPath)
end if
The End Result
Now when we create a chart and set the markerSize to 1.5 we get some lovely big markers.
You can review the code changes on GitHub here.


Join the conversation