
Knowing how to interrogate your machines and get the *precise* information you need from them is a pretty wide-ranging topic. There are any number of ways of approaching this depending on what you need the data for. I’m going to go through some of the ways we keep an eye on our hardware, and where necessary, get detailed data from the server for analysis. Please note that the tools and servers we’re looking at here are Linux and may not be applicable to other server environments.
One of the main things we need to be aware of to get a gauge of how well the server is running is the server load average. This is essentially CPU usage calculated over time intervals (usually 1 minute, 5 minute, and 15 minute). We can see the load averages at a glance using the ‘uptime’ command:
root@jasmine [~]# uptime
15:41:41 up 126 days, 1:40, 2 users, load average: 0.10, 0.07, 0.05
This displays (among a few other things), the 3 load averages. A load average of 1 for a computer with 1 CPU core means that the CPU is fully used – anything over 1 means it’s overloaded. Our machines have 8-core CPUs, so we can see that this machine is very calm at the moment – a load of >8 would indicate overloading.
However, this command doesn’t give us much, and is entirely static. A better command for keeping an eye on the load and the rest of the system utilization is the ‘top’ command, perhaps the single most useful all-rounder for seeing system status at a glance:
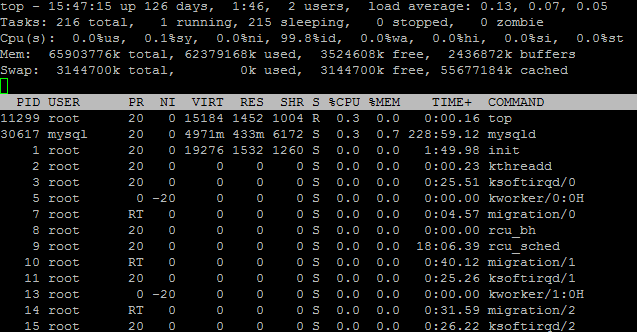
This command gives us an interactive and continuously updated display with the uptime, load averages, number (and status) of running tasks (processes), the CPU usage, the memory usage, and then a list of running processes which we can order in various ways. It’s essentially a command-line analogue of the task manager (windows) or activity monitor (osx), albeit a lot more flexible in some ways.
This shows us a sampling of the current running processes, but what if we need to see a comprehensive list of every single running process on the machine? We can use the ps command. The ps command is used for getting information about processes in various ways, in this instance we want to use the a u and x arguments to give us a detailed list of every single running process. The output of ‘ps -aux’ looks something like this:
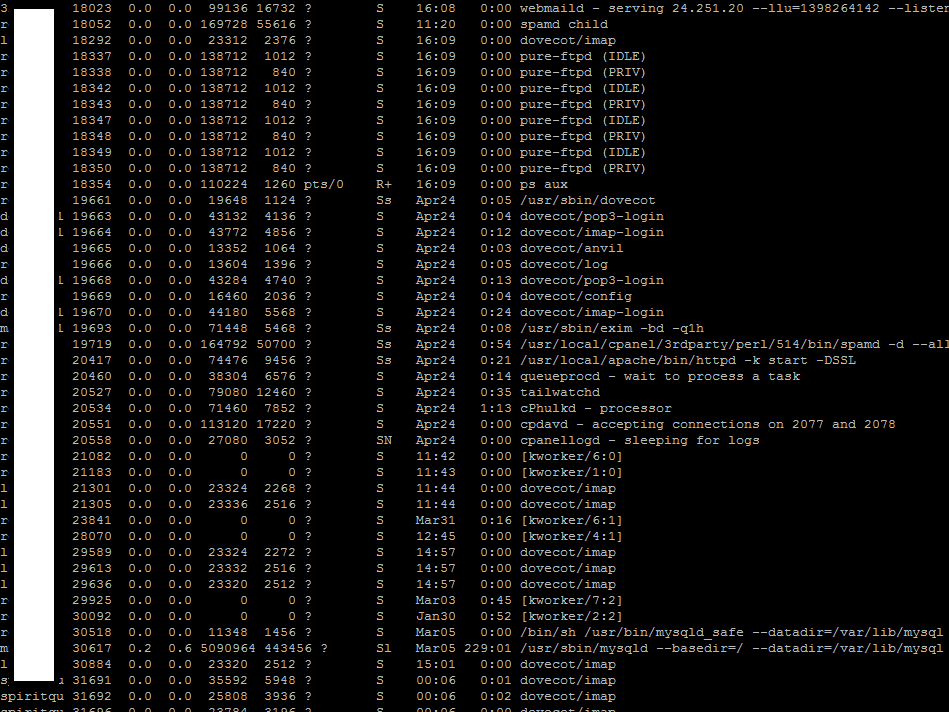
We can look through this to get more of an idea of everything that’s currently running, and if we know what we’re looking for we can search through the output (via the ‘grep’ command for example) to determine whether the expected processes are there or not. This is great, but it’s very hard to read if we just want a summary of the current processlist. There are various utilities that do this, but why not write a quick one that does exactly what we want in LiveCode Server?
#!/usr/local/cpanel/cgi-sys/livecode-server

put $0 into tUserFilter
put shell("ps aux") into tProcessList

repeat for each line tLine in tProcessList
if tUserFilter <> empty and word 1 of tLine <> tUserFilter
then next repeat
add 1 to tOutputArray[word 1 of tLine][word 11 to -1 of tLine]
end repeat

repeat for each key tUser in tOutputArray
put tUser & ":" & return
repeat for each key tProcName in tOutputArray[tUser]
put tab & tProcName & ":" &&
tOutputArray[tUser][tProcName] & return
end repeat
put return
end repeat
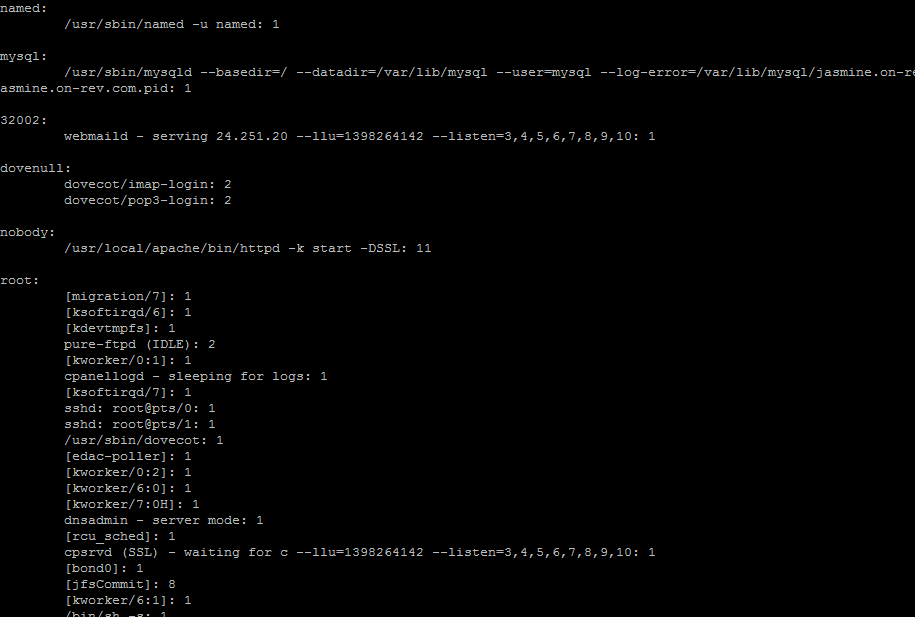
This little script gives us a nice summary of what the running processes are for each user and how many of those processes are running. We can also give it a user to filter by if we only want to see processes from that user using the $x variables – command line arguments passed to a LiveCode app are accessible by using $ and their position in the argument list (in this instance we use $0 to access the first argument passed, which we expect to be a username).
The above tells us all about load and processes, but what if we want to know about what those processes are doing with the disk? There is some standard functionality in Linux for this, but we often use a great utility called ‘iotop’ (non-standard) to get this info, which functions in a similar way to top:
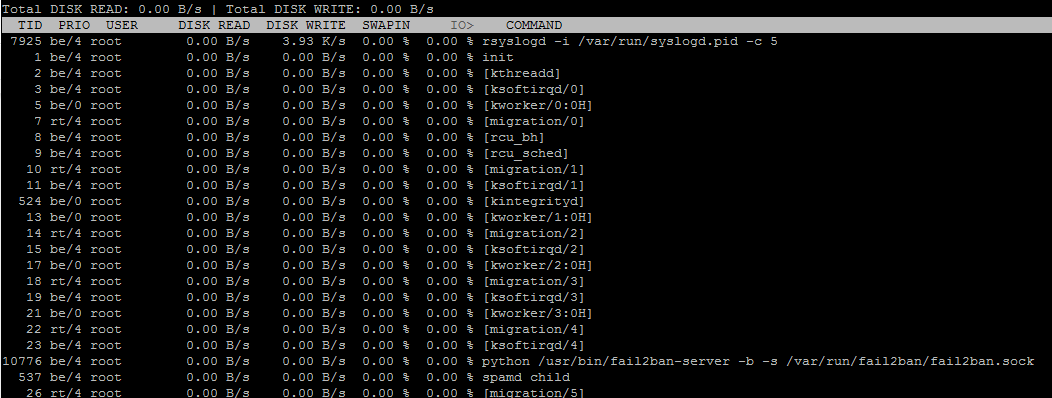
We can see, again, that this server isn’t very busy. One other thing we may want to know about is the current open connections and their status, which we can check using netstat. We almost always use netstat with the -n argument, as otherwise it will try and lookup the hostnames of the addresses involved, which is time-consuming.
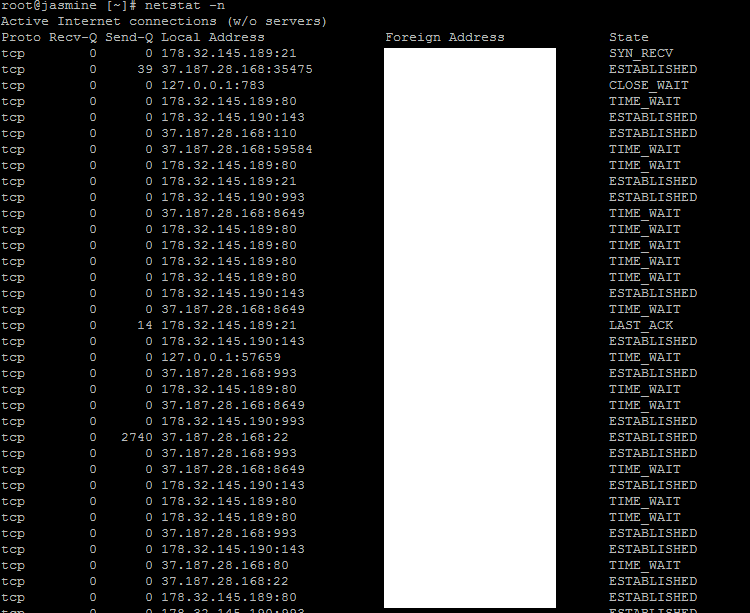
This information contains a list of all the open TCP and UDP connections on the server, with the local address:port and the remote address:port pairs for each. This is very useful as we can quickly look through or parse this data for various purposes, for example we can see all the current mysql connections by using grep (the Linux search command) with the mysql port number:
netstat -n | grep 3306
This is useful as we can see where all these connections are coming from, which can aid in diagnosing certain types of issue. We could expand on this slightly to simply get the number of current mysql connections using the wc (word count) command with the -l (count lines) option:
netstat -n | grep 3306 | wc -l
These are some of the basic command line utilities we use to gather information about the system. There are many many more tools of various complexity that we use which would most likely take a small novel’s worth of blog posts to cover. At the heart of it, being able to query the system for specific information at the command line is often more fast an effective than using a complex GUI-based program that may not tell you precisely what you’re looking for.
3 comments
Join the conversationFaber Muñoz Perez - May 13, 2014
(y)
Faber Muñoz Perez - May 14, 2014
Faber Muñoz Perez liked this on Facebook.
servonomics - May 14, 2014
LiveCode | Keeping an eye on your server: http://t.co/ojqjgsTauP @livecode