The OnPaint handler
The OnPaint handler draws the widget.
The Pie Chart is a fairly complex widget so drawing the widget consists of a number of steps.
- Get the width and the height of the widget.
- Check if the labels are to be shown
- If the labels are not to be shown
- Work out the diameter of the chart – the minimum of the width and height of the widget.
- Work out the rect of the chart – this will be the rect of the widget.
- If the labels are to be shown
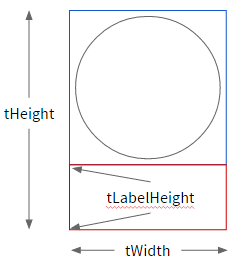
- Work out the area required to show the labels.
- Work out the diameter of the chart, allowing enough space for the labels.
- Work out the rect of the chart and the rect of the label area, depending on the orientation of the widget.
- Work out the radius of the chart – required to draw each sector.
- Work out the origin of the chart – the center of the chart rect.
- Calculate the sum of all the values.
- Calculate the percentage of the chart for each sector, based on the sector value.
- Calculate the start and end angle for each sector, these are used to draw each sector of the card in the correct position.
- Draw the pie chart.
- If labels are to be shown draw the labels.
We’ll implement each step on OnPaint in turn, testing the widget as we go.
Define OnPaint
Start by adding the OnPaint definition and definitions for the first of the required variables.
- tWidth – the width of the widget
- tHeight – the height of the widget
- tDiameter – the diameter of the pie chart
- tChartRect – the pie chart area
- tLabelRect – the labels area
- tLabelLineHeight – the height of a single label
public handler OnPaint()
   variable tWidth as Number
   variable tHeight as Number
   variable tDiameter as Number

   variable tChartRect as Rectangle
   variable tLabelRect as Rectangle
   variable tLabelLineHeight as Number
end handler
The width and height
Get the width and height of the widget and assign the values to the variables tWidth and tHeight.
public handler OnPaint()
   variable tWidth as Number
   variable tHeight as Number
   variable tDiameter as Number
   variable tChartRect as Rectangle
   variable tLabelRect as Rectangle

   put my width into tWidth
   put my height into tHeight

end handler
The chart rectangle
To work out the rectangle of the pie chart area
- Check the showLabels property
- If labels are not to be shown the chart rectangle is the full widget rectangle
- Calculate the diameter
- Allow for some padding between the chart and the edges of the widget
- Assign the rectangle to the tChartRect variable
public handler OnPaint()
   … previous code

   if mShowLabels is false then
      put the minimum of tHeight and tWidth into tDiameter
      subtract kPadding*2 from tDiameter
      put rectangle [0,0,tWidth,tHeight] into tChartRect
   else
      … code continues on next slide
   end if
end handler
If the labels are to be shown
- Declare variables
- Work out how much space the labels require
- Iterate over each label
- Measure the label text on the canvas, this returns the rectangle required to draw the text using the current text size, style and font.
- If the required label width > the current maximum label width update tLabelWidth.
If the required label height> the current maximum label height update tLabelHeight.
public handler OnPaint()
   … previous code
   if mShowLabels is false then
       … previous code
    else
      variable tLabelText as String
      variable tLabelBounds as Rectangle
      variable tLabelWidth as Number
      variable tLabelHeight as Number

      repeat for each element tLabelText in mLabels
         measure tLabelText on this canvas
         put the result into tLabelBounds

         if the width of tLabelBounds > tLabelWidth then
            put the width of tLabelBounds into tLabelWidth
         end if

         if the height of tLabelBounds > tLabelHeight then
            put the height of tLabelBounds into tLabelHeight
         end if
      end repeat
      … code continues on next slide
   end if
end handler
- Assign the line height required for each individual label to tLabelLineHeight
- Calculate the height required to show all the labels.
- Allow space for the color indicator. The indicator is a square width dimensions ⅔ label line height with some padding so add tLabelLineHeight to tLabelWidth.
public handler OnPaint()
   … previous code
   if mShowLabels is false then
       … previous code
    else
      … previous code
      put tLabelHeight into tLabelLineHeight
      put tLabelHeight * (the number of elements in mLabels) into tLabelHeight       add tLabelLineHeight to tLabelWidth
      … code continues
   end if
end handler
The chart and label rectangles
The widget is laid out differently depending on whether is is ‘landscape’ or ‘portrait’.
- Check the orientation of the widget
- Landscape
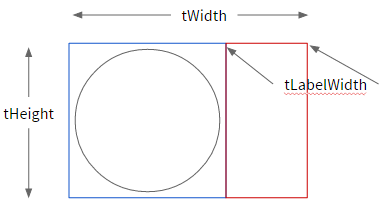
- Calculate the chart diameter: the minimum of (widget width – label width) and widget height.
- Allow for padding around the chart
- Calculate tChartRect: 0,0,widget width – label width, widget height
- Calculate tLabelRect: – widget width – label width,0, widget width, widget height
- Portrait
- Calculate the chart diameter: the minimum of widget width and (widget height-label height).
- Allow for padding around the chart
- Calculate tChartRect: 0,0,widget width,widget height-label height
- Calculate tLabelRect: 0,widget height-label height,widget width, widget height
public handler OnPaint()
   … previous code
   if mShowLabels is false then
       … previous code
   else
       … previous code
      if tWidth > tHeight then
         put the minimum of tHeight and (tWidth - tLabelWidth) into tDiameter          subtract kPadding*2 from tDiameter

         put rectangle [0,0,tWidth-tLabelWidth,tHeight] into tChartRect          put rectangle [tWidth-tLabelWidth,0,tWidth,tHeight] into tLabelRect      else
         put the minimum of tWidth and (tHeight - tLabelHeight) into tDiameter          subtract kPadding*2 from tDiameter
         put rectangle [0,0,tWidth,tHeight-tLabelHeight] into tChartRect          put rectangle [0,tHeight-tLabelHeight,tWidth,tHeight] into tLabelRect      end if
     … code continues on next slide
   end if
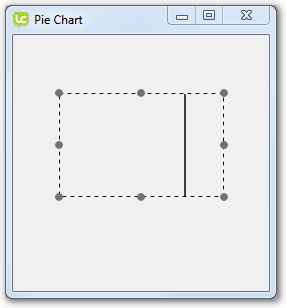
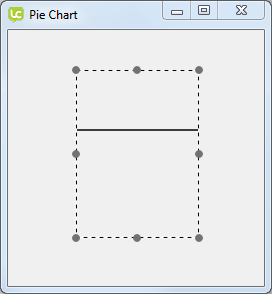
Testing the widget
This is a good point to test the widget to make sure we don’t have any errors.
At this point we are not actually drawing anything to the canvas so to check the chart and label rectangles are in the place add a couple of temporary lines to draw the rectangles to the canvas.
Note: in this example we don’t explicitly address the possibility that the label width or height will be greater than that of the widget. In that case the widget will still render but the content will overlap or be outside the widget area.
public handler OnPaint()
   … previous code
   if mShowLabels is false then
       … previous code
   else
       … previous code
      stroke rectangle path of tChartRect on this canvas
      stroke rectangle path of tLabelRect on this canvas
   end if
end handler
To test the widget
- Open the Extension Builder from the Tools menu.
- Load in the ‘pieChart.lcb’ file.
- Click Test.
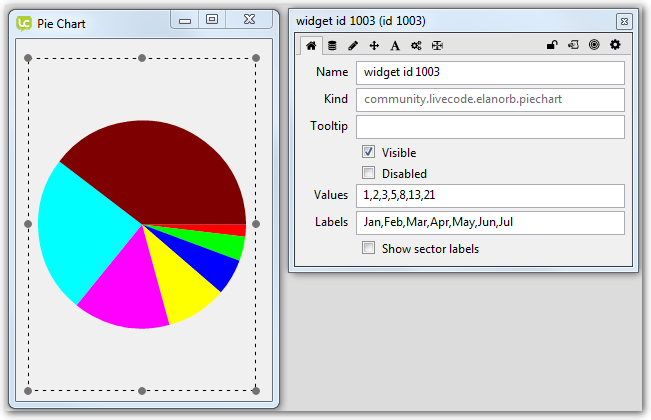
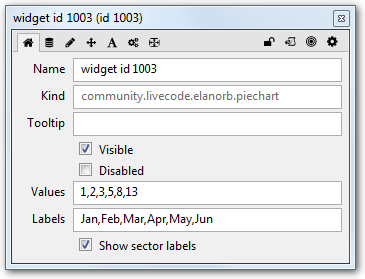
- Open the Property Inspector to check the widget properties.
- Select the widget and resize it to check the chart and label areas change size.
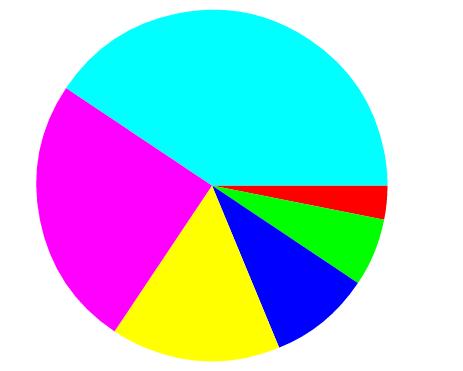
Drawing the Pie Chart
The next step is to draw the pie chart.
- Calculate the sum of all the values
- Work out what percentage of the pie chart each sector should take up
- Calculate the size of the angle of each sector
- Draw the filled sector. The color of the sector comes from the list if colors that was initialised earlier.
| Label | Value | % | Angle |
| Jan | 1 | 3.125 | 11.25 |
| Feb | 2 | 6.25 | 22.5 |
| Mar | 3 | 9.375 | 33.75 |
| Apr | 5 | 15.625 | 56.25 |
| May | 8 | 25 | 90 |
| Jun | 13 | 40.625 | 146.25 |
At this stage we will remove the temporary stroke commands that drew the rectangles around the chart and label areas.
To draw the chart
- Declare the tTotal and tElement variables
- Calculate the sum of all the values. Remember to convert the value from a string to a number.
public handler OnPaint() … previous code if mShowLabels is false then … previous code else … previous codestroke rectangle path of tChartRect on this canvasstroke rectangle path of tLabelRect on this canvasend if variable tTotal as Number variable tElement as String repeat for each element tElement in mValues add tElement parsed as number to tTotal end repeat … code continues end handler
To draw the chart
- Declare the tRadius, tChartOrigin, tStartAngle, tAngle, tPath and tSectorNumber variables.
- Calculate the radius
Work out the origin of the chart as a Point. The origin is the centre of the chart rectangle.
public handler OnPaint()
    … previous code
   variable tRadius as Number
   variable tChartOrigin as Point
   variable tStartAngle as Number
   variable tAngle as Number
   variable tPath as Path
   variable tSectorNumber as Number

   put tDiameter / 2 into tRadius
   put point [the width of tChartRect/2,the height of tChartRect/2] into tChartOrigin
   … code continues
end handler
Drawing the Pie Chart
- Iterate across each value in mValues.
- Calculate the sector number
- Work out the sector angle as a fraction of the circle.
- Empty the tPath variable
- Get the sector path of the sector using the chart origin, radius, start and end angle.
- Set the paint of the canvas to the corresponding color in the mColors list.
- Fill the path to draw the sector.
- Add the angle to tStartAngle to be used in the next iteration.
public handler OnPaint()
    … previous code
   repeat for each element tElement in mValues
      add 1 to tSectorNumber
      put (tElement parsed as number/tTotal) * 360 into tAngle
      put the empty path into tPath
      put sector path centered at tChartOrigin with radii [tRadius,tRadius] from tStartAngle to (tStartAngle + tAngle) into tPath

      set the paint of this canvas to solid paint with element tSectorNumber of mColors
      fill tPath on this canvas
      add tAngle to tStartAngle
   end repeat
   … code continues
end handler
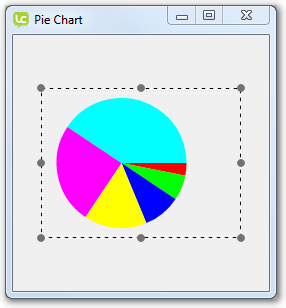
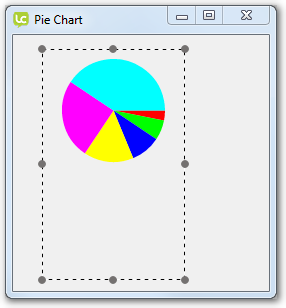
Testing the widget
To test the widget
- Open the Extension Builder from the Tools menu.
- Load in the ‘pieChart.lcb’ file.
- Click Test.
- Select the widget and resize it.
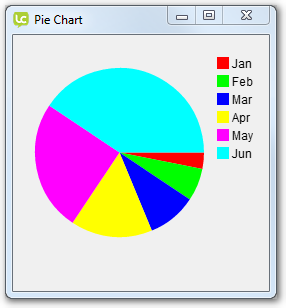
- Open the Property Inspector. Add another value to the Values property: 1,2,3,5,8,13,21.
Showing the labels
If the Show labels(mShowLabels) property is true we want to show the labels in the tLabelRect area. LiveCode Builder cannot currently draw multi-line text so we draw each label individually.
- Declare variables
- Check if labels are to be shown.
- Calculate the dimension and padding of the color indicator
- Assign values to the tLineTop and tSectorNumber variables
public handler OnPaint()
   … previous code
   variable tLineTop as Number
   variable tLineRect as Rectangle
   variable tColorIndicatorDimension as Number
   variable tColorIndicatorPadding as Number
   variable tColorIndicatorPath as Path

   if mShowLabels is true then
      put (tLabelLineHeight/3) * 2 into tColorIndicatorDimension
      put tLabelLineHeight/6 into tColorIndicatorPadding

      put the top of tLabelRect into tLineTop
      put 0 into tSectorNumber
           … code continues

end handler
- Iterate over each label
- Update the sector number
- Calculate the rectangle of the color indicator
- Set the color of the canvas to the sector color
- Draw the color indicator
- Calculate the rectangle of the label
- Set the color of the canvas to black
- Draw the text from the top left of the label rectangle
- Calculate the top of the next label ready for use in the next iteration
public handler OnPaint()
    … previous code
   if mShowLabels is true then
     … previous code
     repeat for each element tElement in mLabels
          add 1 to tSectorNumber
          put rectangle path of rectangle [the left of tLabelRect + tColorIndicatorPadding, tLineTop + tColorIndicatorPadding, the left of tLabelRect + tColorIndicatorDimension + tColorIndicatorPadding,tLineTop + tColorIndicatorDimension + tColorIndicatorPadding] into tColorIndicatorPath
          set the paint of this canvas to solid paint with element tSectorNumber of mColors
          fill tColorIndicatorPath on this canvas
          put rectangle [the left of tLabelRect + tLabelLineHeight,tLineTop,tWidth,tLineTop + tLabelLineHeight] into tLineRect           set the paint of this canvas to solid paint with color [0,0,0,1]           fill text tElement at top left of tLineRect on this canvas
          add tLabelLineHeight to tLineTop
      end repeat
  end if
end handler
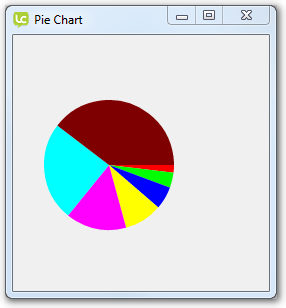
Testing the widget
To test the widget
- Open the Extension Builder from the Tools menu.
- Load in the ‘pieChart.lcb’ file.
- Click Test.
- Open the Property Inspector
- Try changing some properties
- Add another value
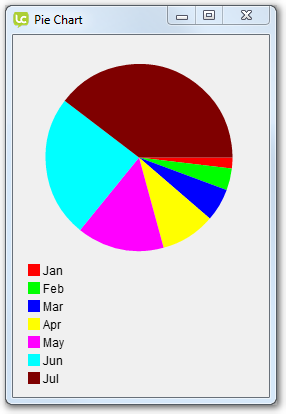
- Add another label
- Switch Show labels off