

Business
LiveCode Script Profiler
The Script Profiler allows you to examine your scripts in detail for performance and efficiency. You can load an object, handler, complete script or entire stack into the Profiler, and discover exactly how long each line of code is taking to run. Sounds simple? It is - simply invaluable. Optimize complex code to remove bottlenecks and ensure your finished app runs as fast and smoothly as possible.
How you use it
The UI allows you to choose a stack, a card or an object to profile, then select which parts you want to include or just tick “Profile Everything”. Click on the “Start Profile” button, then return to the stack you are examining and run your code. Easy.
What it does
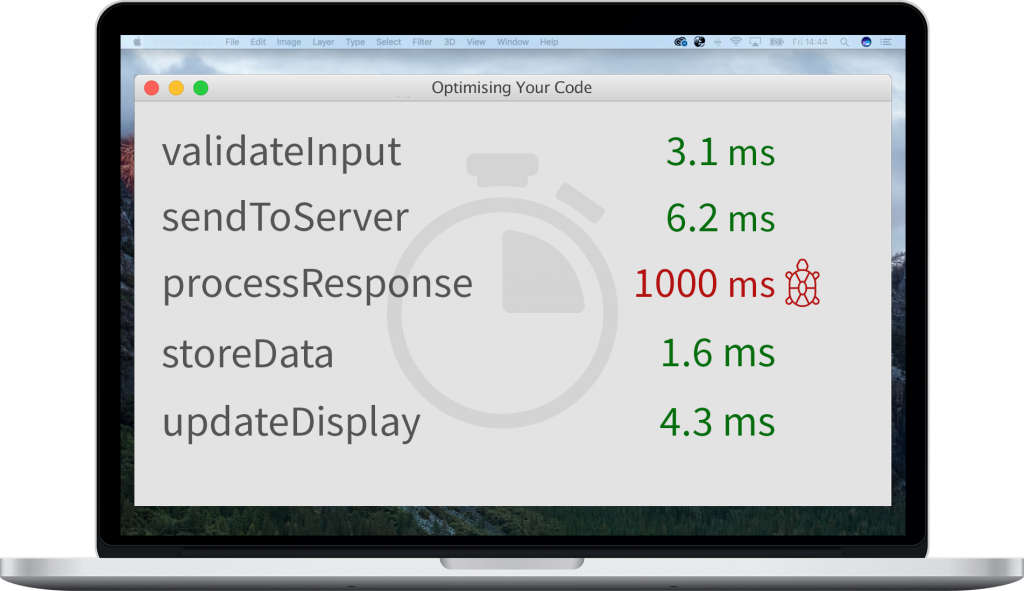
The Script Profiler runs through the scripts you indicate you want profiled, and outputs the line number, number of times the script is called, and the total number of milliseconds that line of code is taking to execute. Knowledge is Power!
Use Cases
The Profiler can help you identify inefficiencies, and test possible solutions to see if you have removed the bottleneck. For example, it has been used to show that carrying out a series of text operations on blocks of text was slow, but a switch to splitting up the text into an array and doing the operations on the elements of the array was much faster.
Script Profiler is available with the LiveCode Business license, in LiveCode 9.0, dp5 and above.