
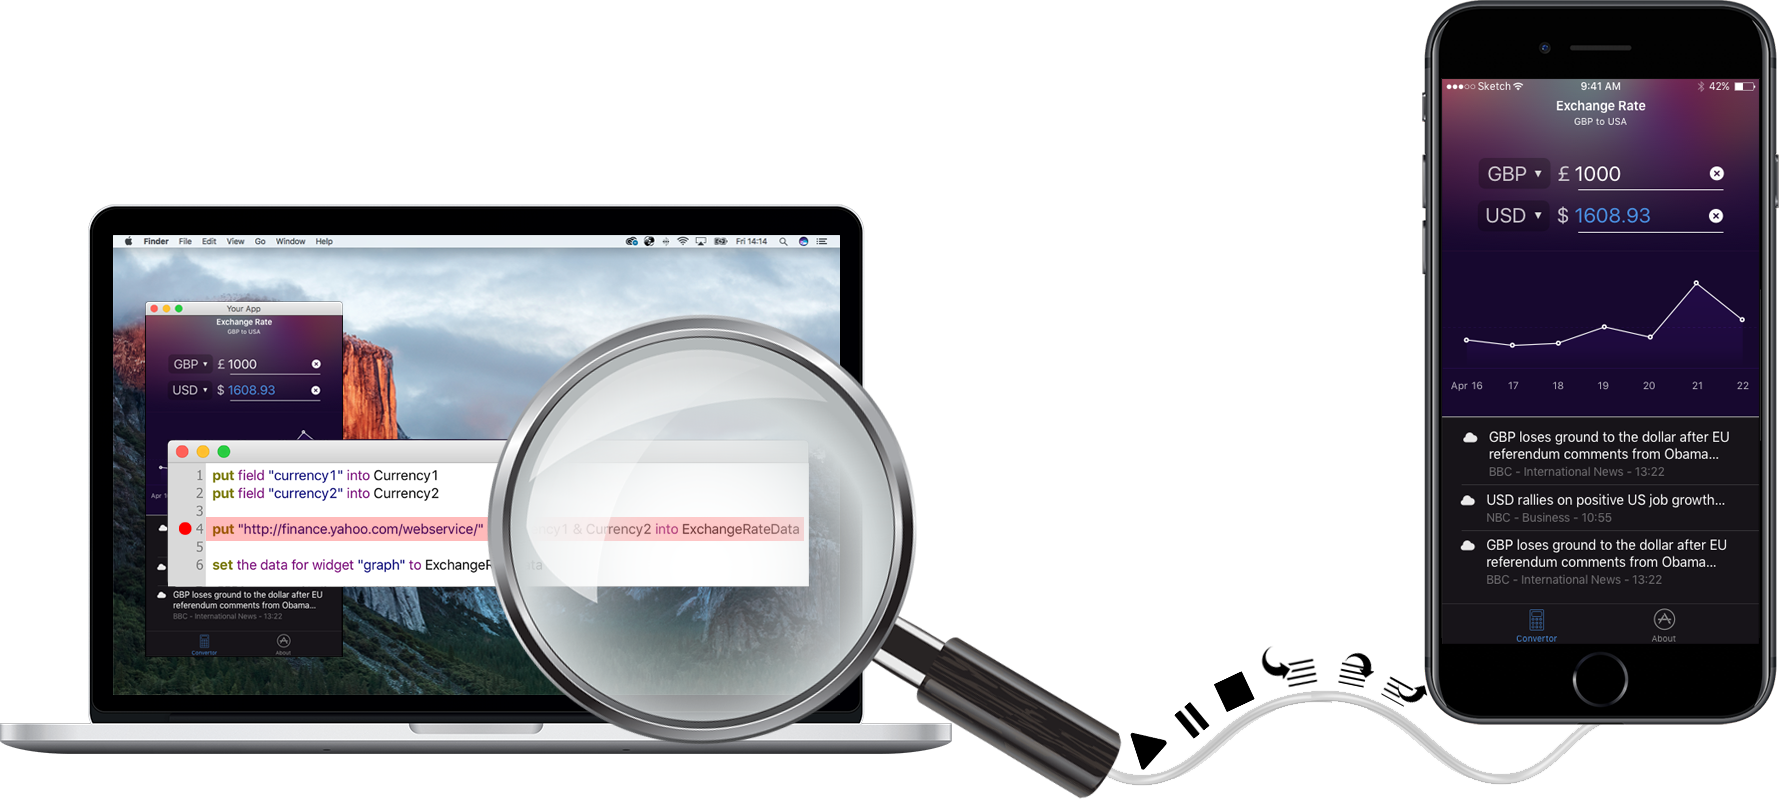
With LiveCode’s new remote debugger available in the LiveCode Business edition, you can debug your standalone applications using the IDE script editor just as you can when running them in the IDE.
What does it do?
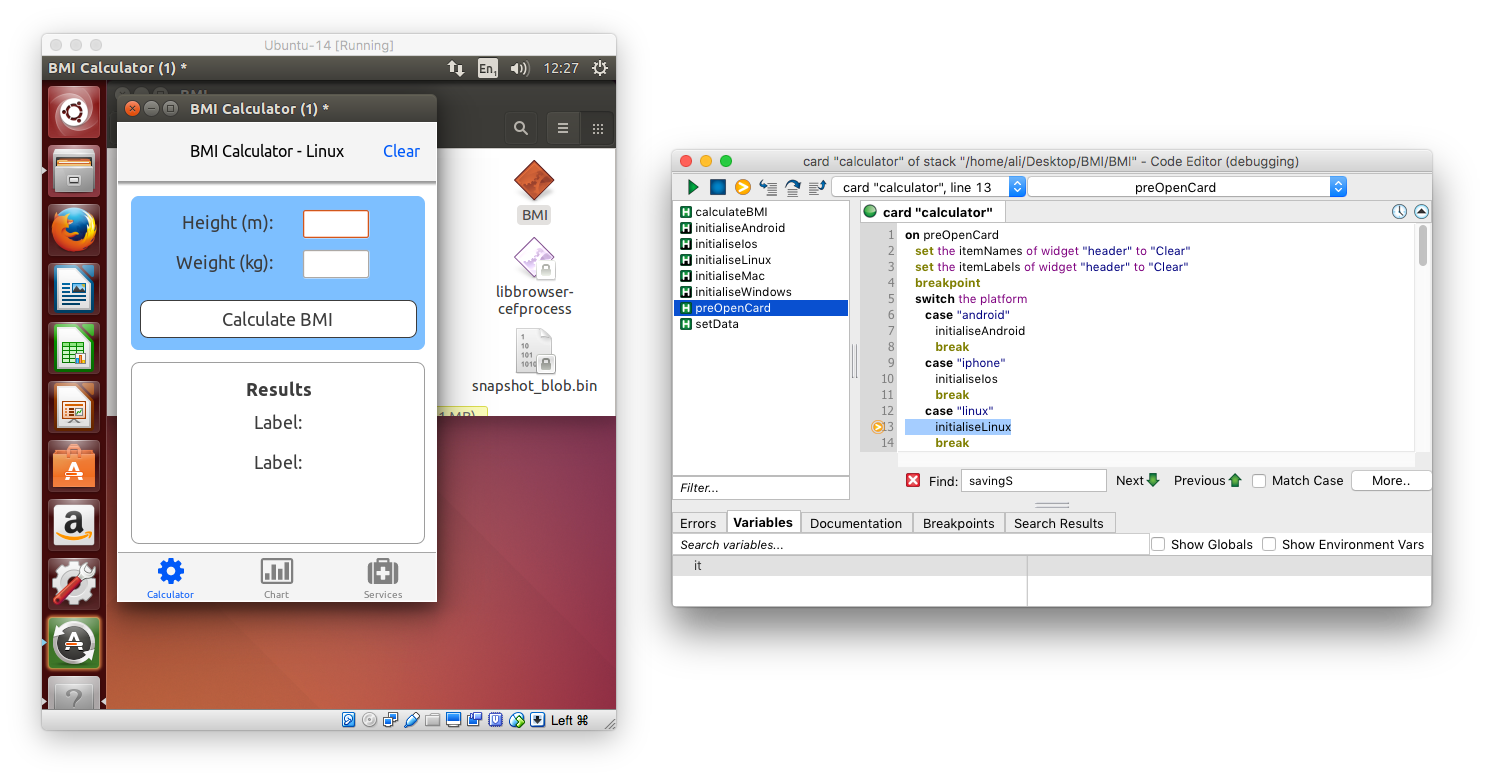
When the remote debugger is active, breakpoints in a standalone application’s scripts will trigger the debugger in the IDE. The script editor opens, and you can control execution in the standalone using the standard step out/over/in, stop and play buttons.
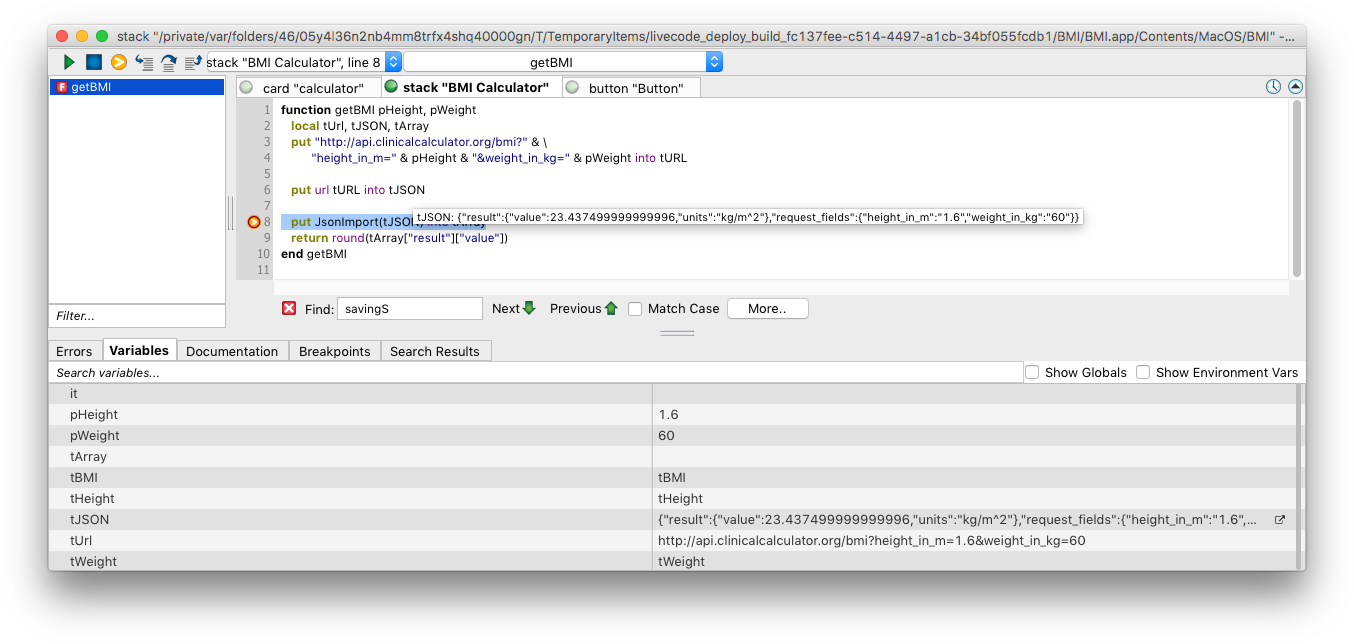
You can hover over variables in the script editor to view their values,
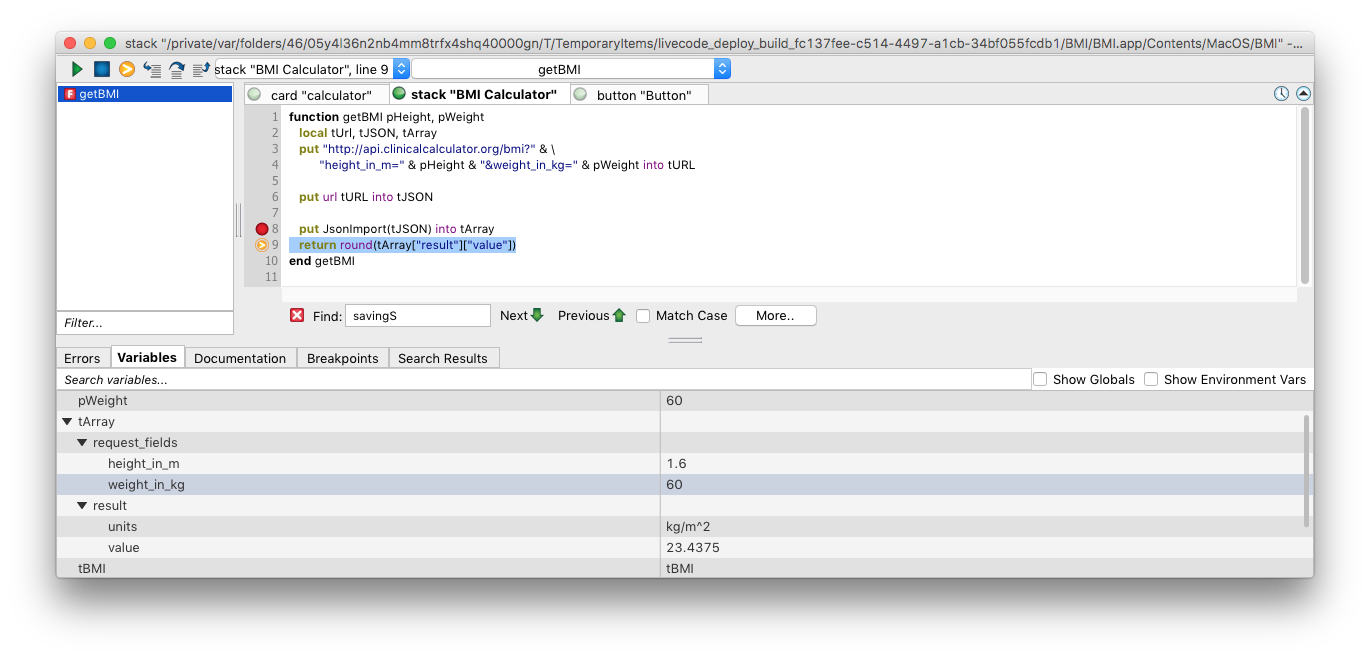
see all the variables in the current debug context in the variable viewer pane,
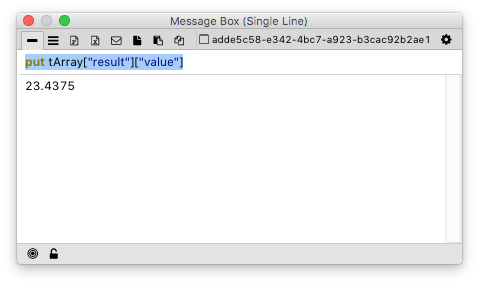
and output the values of variables to the message box using put tVar.
How do I use it?
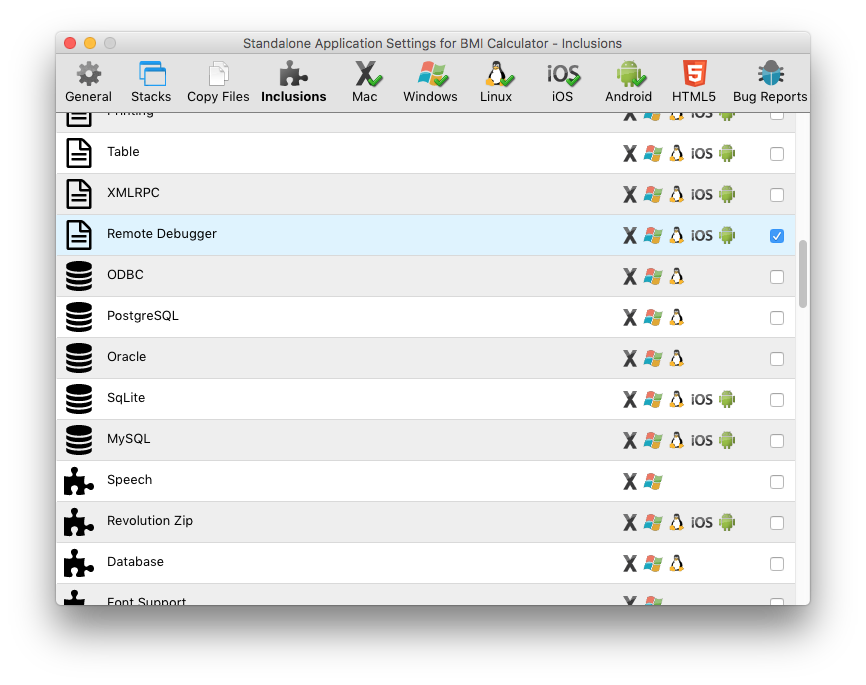
If you are using the ‘Test’ button to run your app from the IDE, the remote debugger will be included in the app automatically. Otherwise, if you are saving a standalone, simply include the remote debugger in your standalone application using the Inclusions pane of the standalone settings stack.
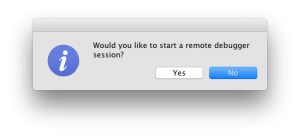
When the standalone launches, if there is an instance of the IDE running, it will ask if you would like to start a remote debugging session. Simply click yes to activate the remote debugger!
When the standalone quits, you will see a dialog confirming that the remote debug session has ended.
What can I use it on?
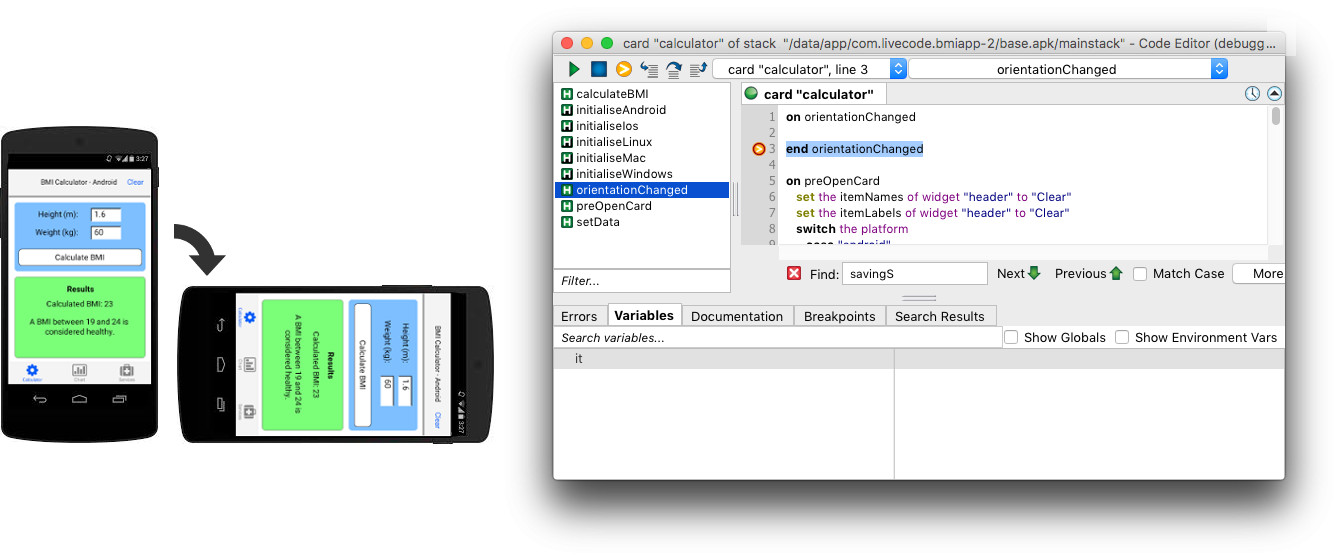
The standalone you are debugging does not have to be running on the same platform as your IDE. You can debug LiveCode applications running on iPhone / iPad simulators and devices, Android emulators and devices, and virtual machines.
This means in particular it is possible to debug code paths that do not actually run on the local machine, such as orientationChanged handlers when a device is turned.
What else can I do with it?
There are a couple of other great features that come with the remote debugger.
Remote logging
Another great feature of the remote debugger is that it will route any `put` commands without a target into the IDE message box. So if you have any such commands for logging purposes, you will be able to see the output in the IDE
Tweak properties of your app
When a breakpoint is triggered, commands from in the message box are executed in the current debug context. This means you can tweak features of your app (such as the fullscreenmode) ‘live’ to see how they change it on the device and simulator, without having to change the code and re-deploy. Note these changes do not persist in your app and are merely for testing purposes. Any changes you wish to make must be made in the IDE and the app redeployed.
Remote Debugging is a LiveCode Business edition feature available from version 9.0.0 DP5 onwards

1 comment
Join the conversationJimL - February 23, 2017
What a invaluable time saver!