
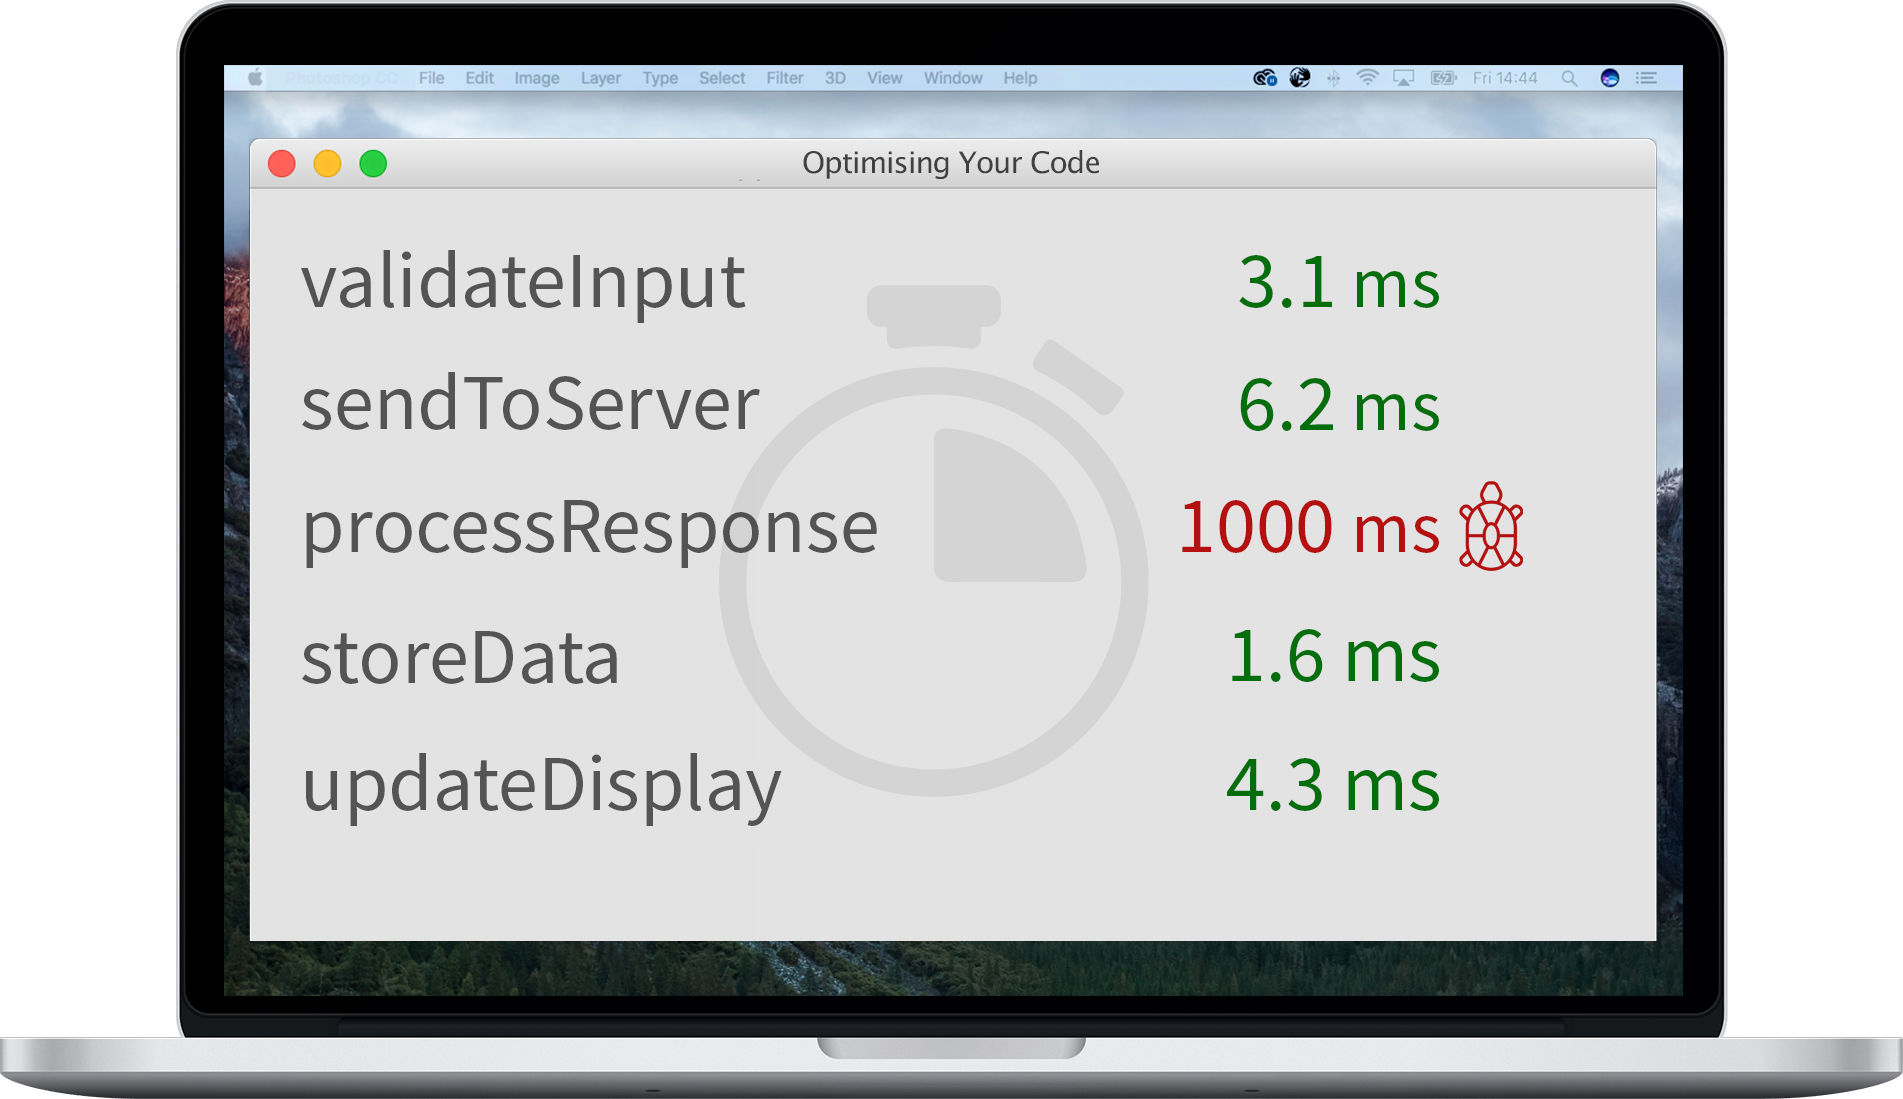
LiveCode’s new Script Profiler, available in the LiveCode Business edition, can help you identify the most costly lines of code in a stack. This can help you optimise your code by identifying inefficiencies.
To use the Script Profiler you open a stack, start the profiler and use the stack. When each line of a script in the stack is executed the execution time will be recorded. When the profiler is stopped a report is presented.
In this example we will look at an area that can often benefit from some optimisation, looping over an array. This example just uses a simple array with 10000 values in it. The code loops across the array and prints out all the values stored in the array.
Open the stack you want to profile
Open the stack you want to profile, and ensure it is the topStack.
The initial looping code is
command arrayLoop
   local tList

   put empty into field "list"
   repeat with x = 1 to the number of lines in the keys of sTestArray
      put line x of the keys of sTestArray into tKey
      put sTestArray[tKey] & return after tList
   end repeat

   put tList into field "list"
end arrayLoop
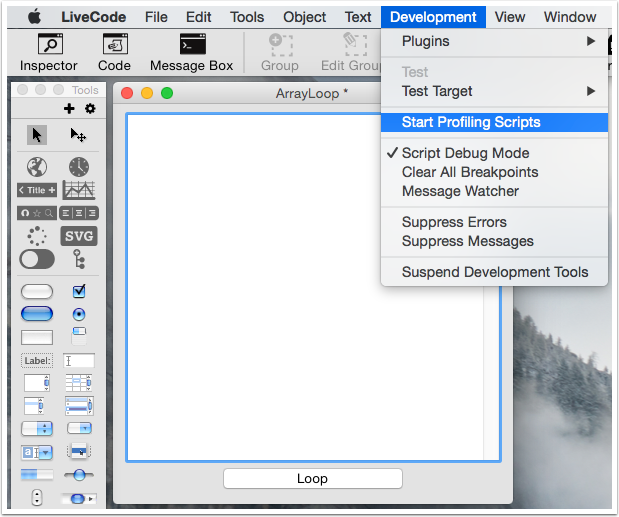
Start the Script Profiler
Choose ‘Start Profiling Scripts’ from the Development menu, this will begin profiling the topStack.
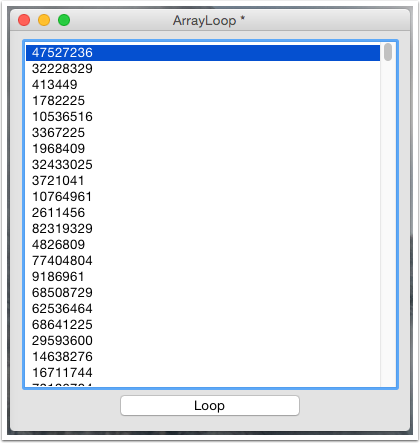
Use the Stack
Starting using the stack to begin the profile, when each line of a script in the stack is executed the execution time will be recorded.
Stop the Script Profiler
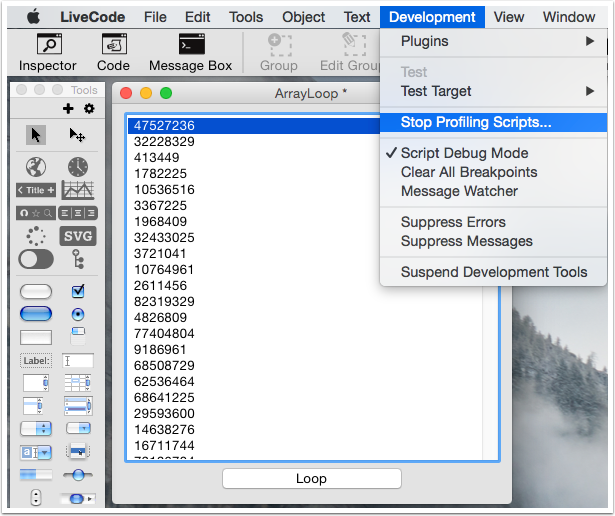
To stop the Script Profiler select ‘Stop Profiling Scripts’ from the Development menu.
The Script Profile Report
When the Script Profiler is stopped a report is shown.
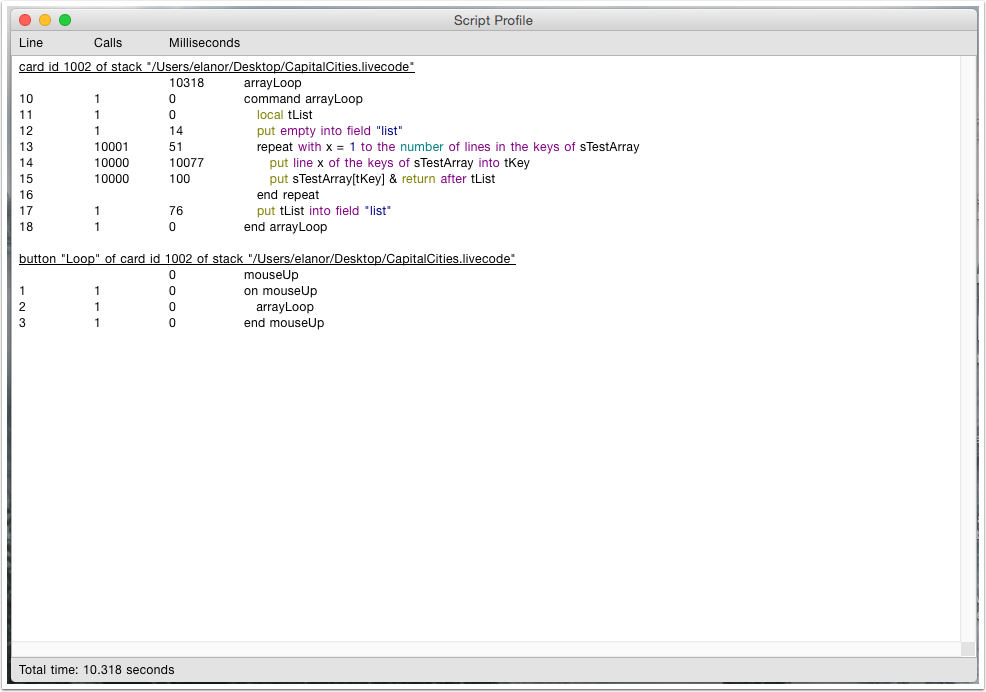
The report shows each line of script that was executed
- the line number
- number of times the line was called
- the time to execute the line
The total time in seconds is displayed at the bottom of the report.
Double clicking a line in the report will open the line of script in the Script Editor.
Optimisation
Now we can see where all the time is going we know where we want to optimise our code.
In this example the vast majority of the time is spent on the line
put line x of the keys of sTestArray into tKey
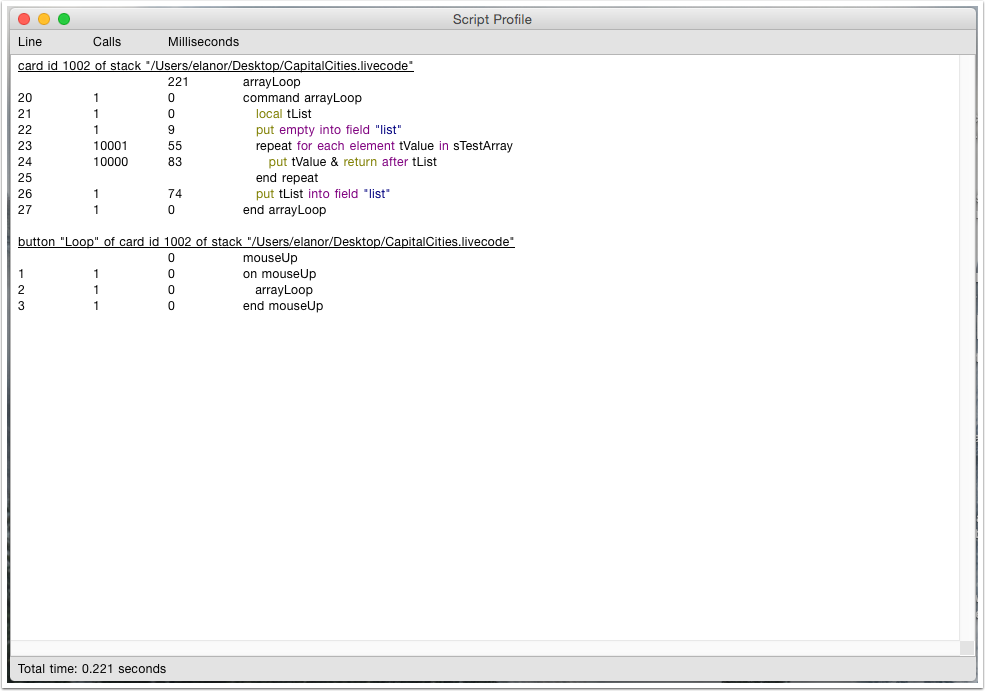
With a little thought we can see that we can change the form of the repeat loop we are using to something more efficient. We are only really interested in the values stored in the array, not the keys, so we can change the code to loop across the elements of the array.
command arrayLoop
   local tList

   put empty into field "list"
   repeat for each element tValue in sTestArray
      put tValue & return after tList
   end repeat

   put tList into field "list"
end arrayLoop
Now run the Script Profiler again and see how much faster the code is, 0.221 seconds rather than 10.318 seconds.
Alternative Ways to Start and Stop the Script Profiler
You can also start and stop the Script Profiler using the stack context menu, opened by ctrl/right clicking on the stack, or via the stack context menu in the Project Browser.
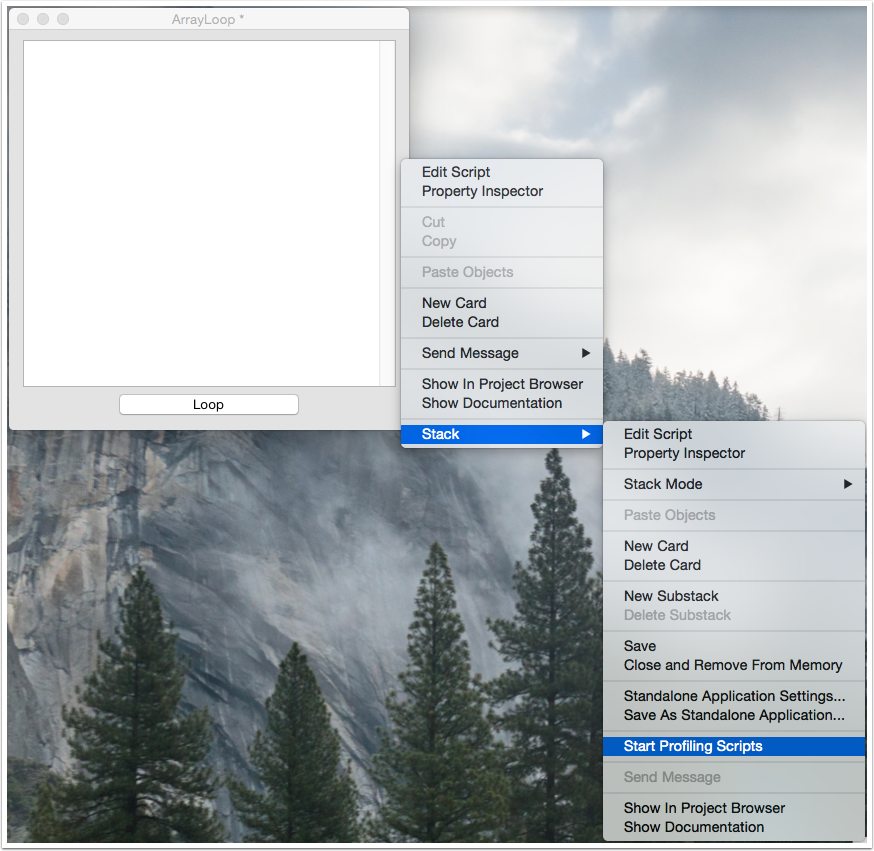
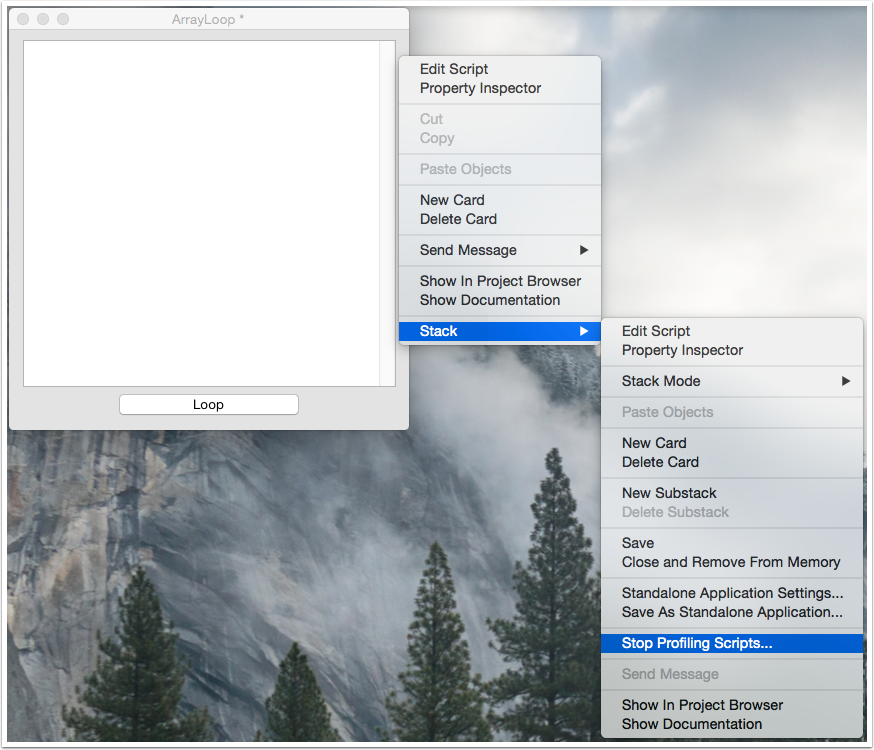
Using the stack context menu
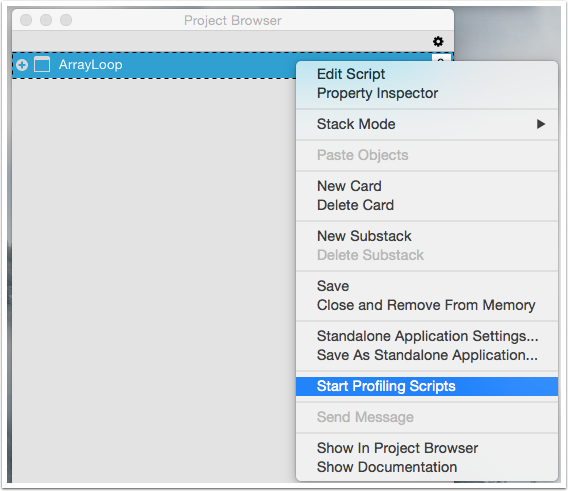
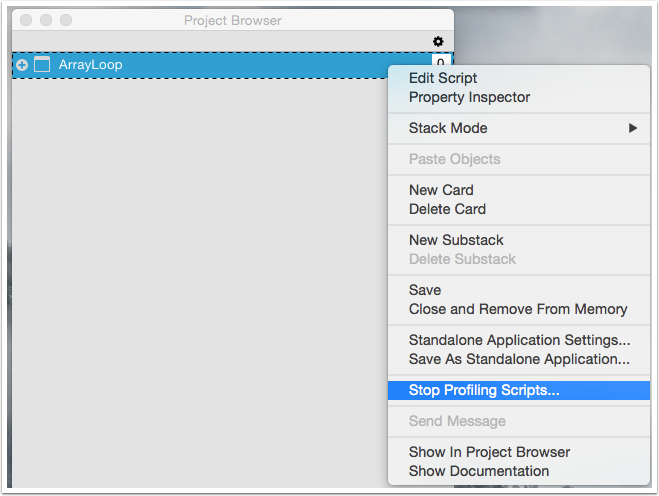
Using the Project Browser
Available in LiveCode Business Edition 9.0.0 DP-5 onwards.

4 comments
Join the conversationJames Hale - February 24, 2017
So does this mean that “script profiling” is in effect a stack property’?
By this I mean that in a multi stack project I can, for instance, turn on script profiling for one of my library stacks and then only get the profiler kicking in whenever a call is made to a handle/function in the ‘activated’ library stack.
Elanor Buchanan - March 3, 2017
Hi James
Yes, the Script Profiler works by setting the traceStack. So if you start it on your library stack it will then report the calls made to that library stack.
I hope that helps.
Elanor
lorent - March 6, 2017
Hello!
I’m very bad in this stuff but your post help me to understand something!
Thanks!
Elanor Buchanan - March 6, 2017
Hi Lorent, I’m glad the article helped.
Elanor